Back on track of PL-300 Cert journey
Last few week I talked about Data Modeling concept in Power PL you can check out on my previous blog here ;
What you will dive through another level of Data Modeling.
📖 How to develop a semantic layer over your data in Power BI To create and configure model objects, including tables, columns, hierarchies, measures, and parameters.
This process ensure accurate analysis and design a semantic model, that impact to power BI report.

“Let’s explore for the heart of Power BI 💛”
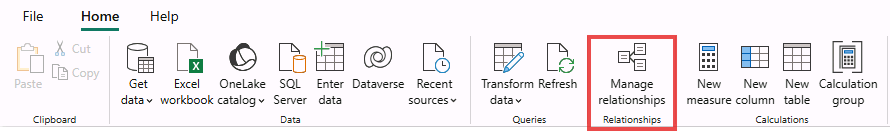
📌All operation, we will work on “Model view pane” 📌
🧩 Relationship Model
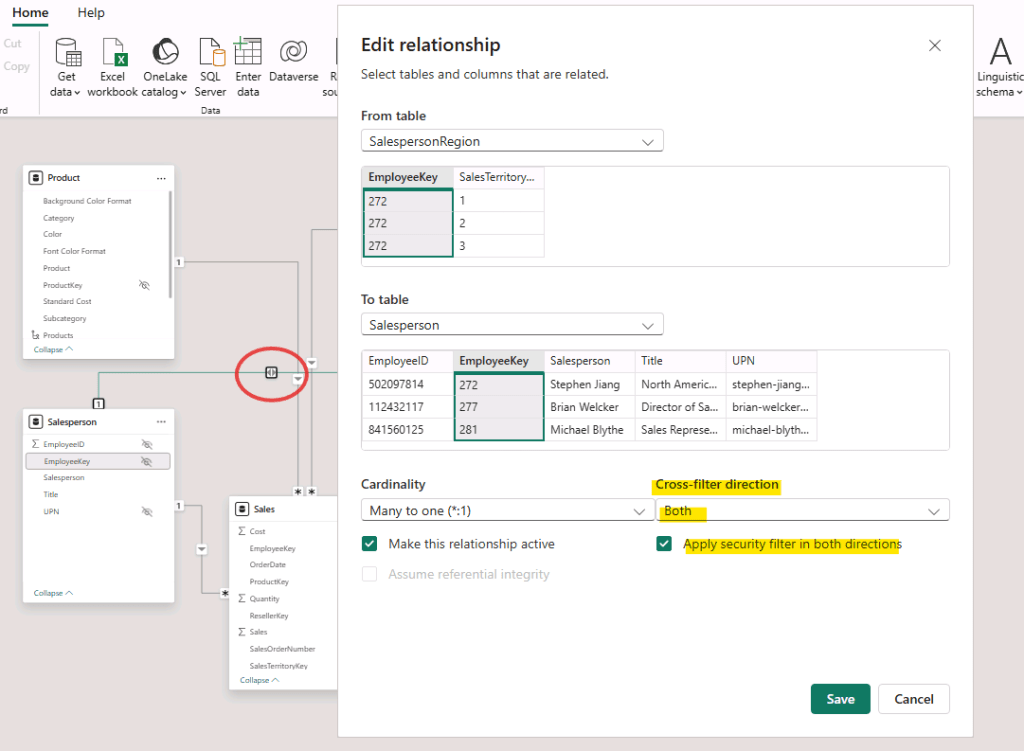
📖 To create relationship between tables after reshaping data in Power Query.
Selecting the “Model view” > Going to manage relationship on the ribbon tap.
You can create the relationship between table here.
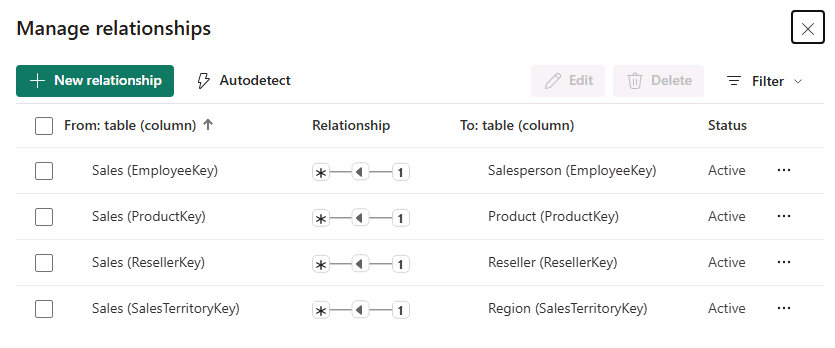
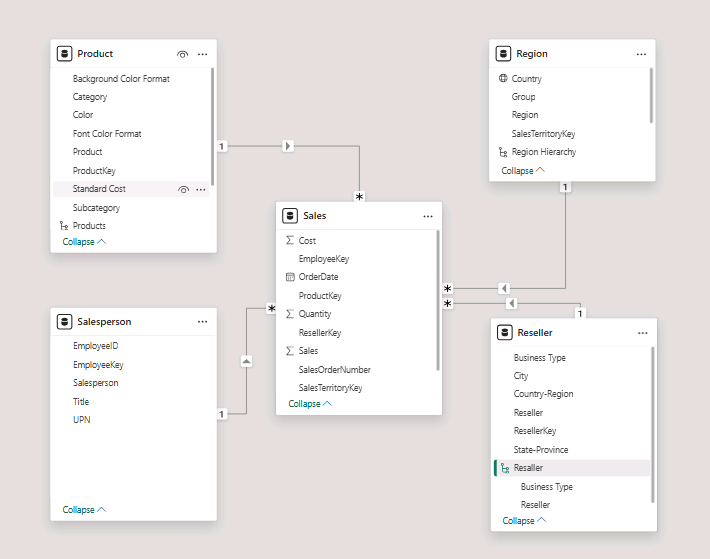
OR drag and drop between table, you will connect tables and picture below.
💡 Cardinality type is One To Many (1:*) One-to-many relationships are the most common cardinality, and all relationship you create in this lab will be this type.
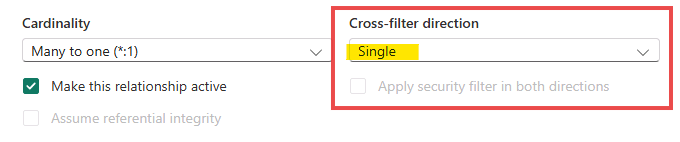
💡 Cross Filter Direction type is Single. Single filter direction means that filters propagate from the “one side” to the “many side”
💡 Cross Filter Direction type is Both. To cross filter direction setting (also known as bidirectional filtering) allows filters to propagate in both directions between two related tables
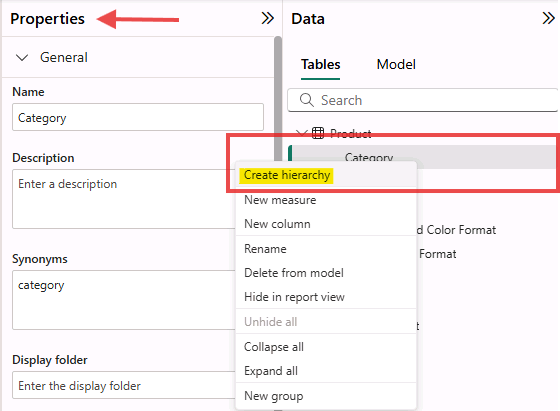
🧩 Create hierarchy.
📖 To enable drill-down functionality
Right click > selecting “Create hierarchy”
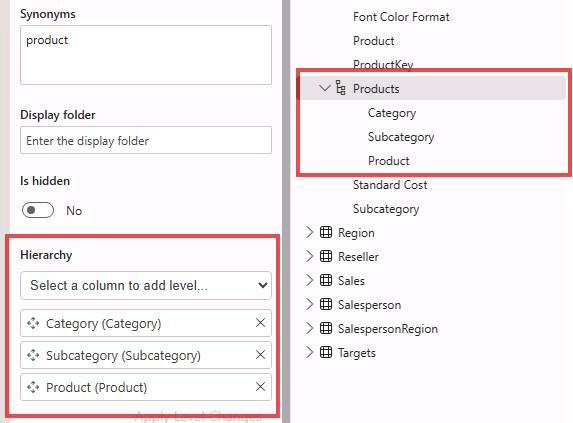
Adding levels to the hierarchy, in the Hierarchy dropdown list,
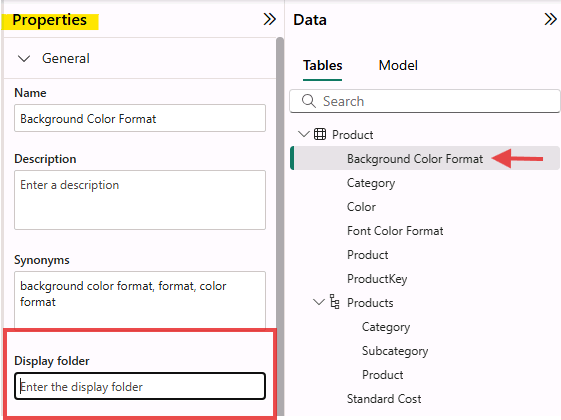
🧩 Organize columns into a display folder
📖 To declutter the data model and improves usability.
Selecting column that you want to group > Going “Display folder” in properties pane.
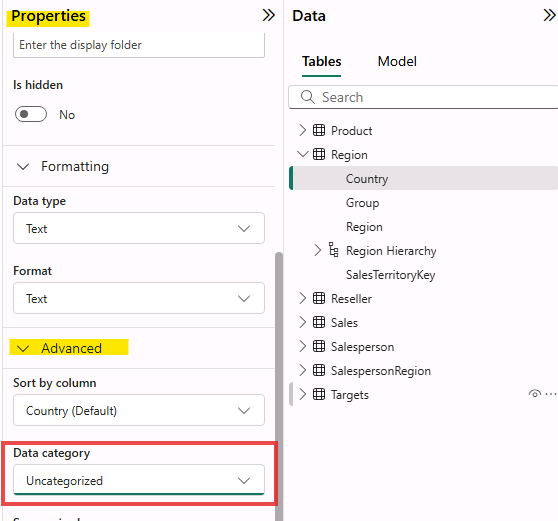
🧩 Configure the Region table
📖 To update data categories to the appropriate geographic type
Selecting column which relate to region or country
Going to properties pane. > Advance session > Data Category >
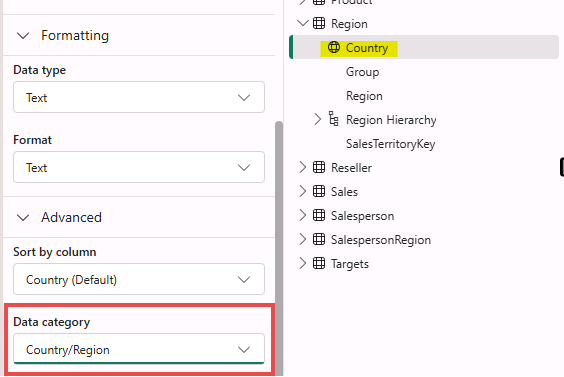
Using dropdown select “Country and region”
(There is several types of geography)
Once category change,
You will see additional symbol pop-up in column name. 🌏
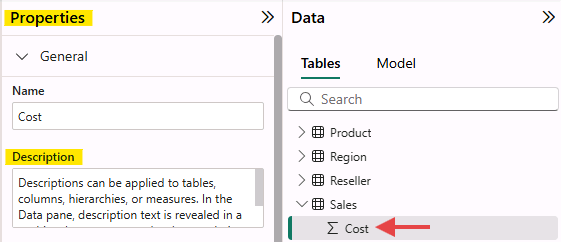
🧩 Identify column with description
📖 To add descriptions to columns to improve report documentation and usability.
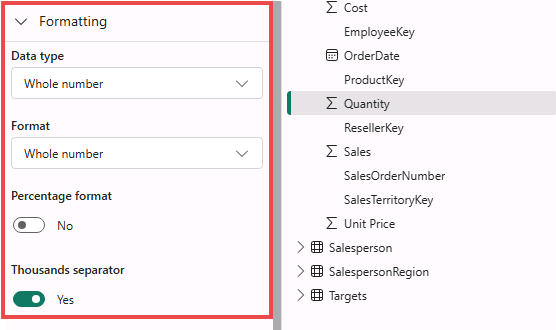
🧩Adjust formatting
📖 To customize data labels for specific visuals.
Selecting numerical column > go to properties > scroll down to “Formatting session” you can choose data types, format, percentage and separator.
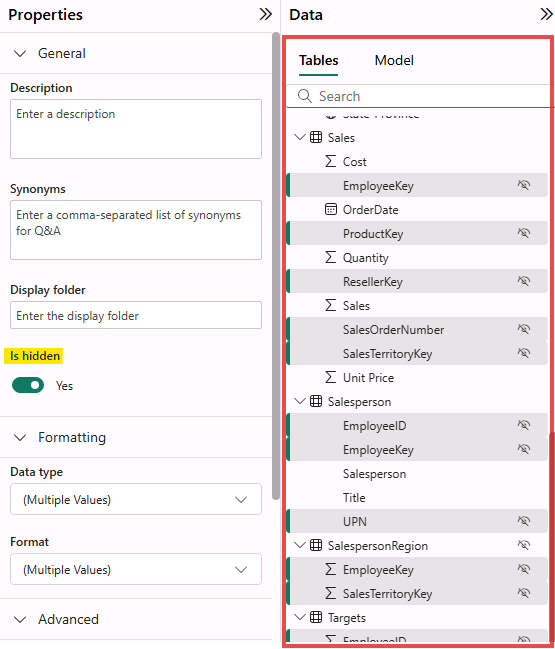
🧩 Hidden multiple not use columns
📖 To keeps them available for back-end logic (relationships, measures) in Model view but prevents them from cluttering the front-end
Report view for users
🧩 Create quick measure
📖 To quickly create DAX formulas for common calculations.
By selecting a calculation type and dragging fields into a dialog box, Power BI automatically generates the underlying DAX code
🔥 DAX = Sum of Sales minus Sum of Cost = SUM(‘Sales'[Sales]) – SUM(‘Sales'[Cost]) 🔥
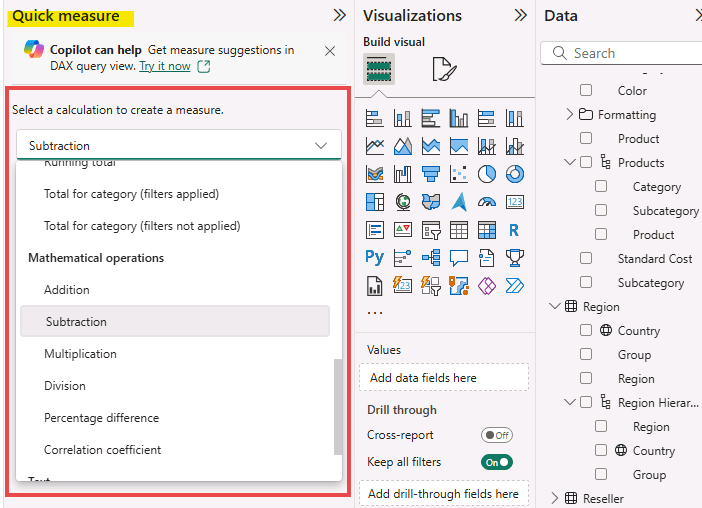
🤩 Quick measures allow you to easily perform complex calculations without needing deep DAX knowledge and provide a way to learn the syntax by reviewing the generated formulas
Now you know about configure a semantic model and
How to structuring data, defining relationships, and create quick measure to turn raw data into a trusted, business-friendly layer.
The journey hasn’t end see you in the next blog. 🖤
Until I get the certification 🤩

Leave a comment