
Mention to the first blog of Power Query
I have written about data preparation concept one which explain about cleaning data for ensuring accuracy, efficiency and consistency.
Moreover, it’s including basic of data transformation.
Under the series of data transformation, there are several techniques that will learn with Power Query.
To be mastering in Power Query, this context will be focusing on the reshaping data which talk about how to organize data within the table.
One of important preparation step for analysis.
💡 The 3 main feature to reshape the data
- Unpivot and Pivot column
- Transpose
- Group by
And additional tip and trick 😉
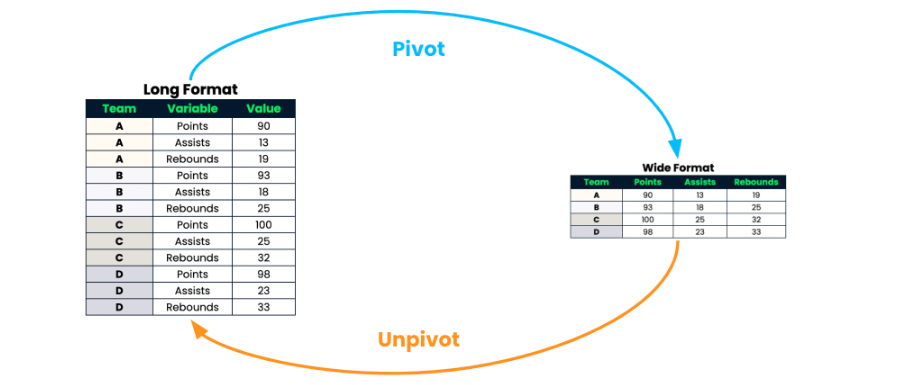
There are two main structures which are long data structure and wide data structure.
2 types of format which you need to RESHAPE for more understandable.
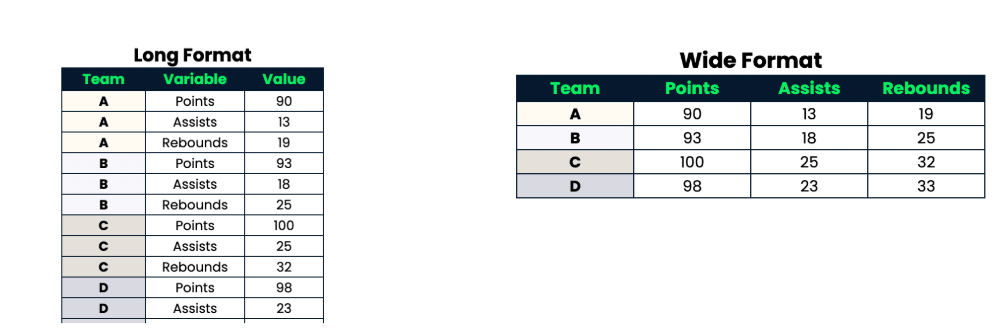
Long data structure will contain repeating value in the first column and most of the structure data included only one numerical column.
Wide data structure is more human readable and easy to analyst because it contains unique on first column, multiple numerical columns and one for each variable.
“Usually transformed long to wide format are vice vasa.”
🧩 Let’s explore how to reshare data.
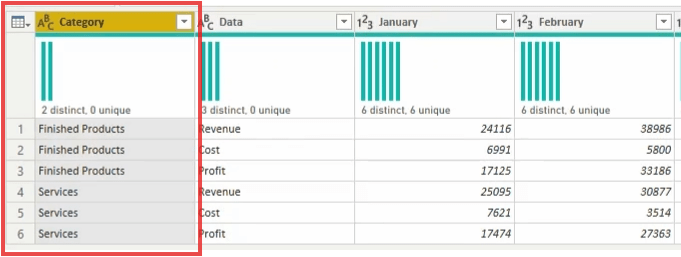
Here is the example dataset which represent business categorization , revenue, cost, and profit and subsequent column contains data for each month, but those data isn’t efficient to analyst data.
You will see in each of categories include revenue, cost, and profit by month in separated rows and they are included the missing values.
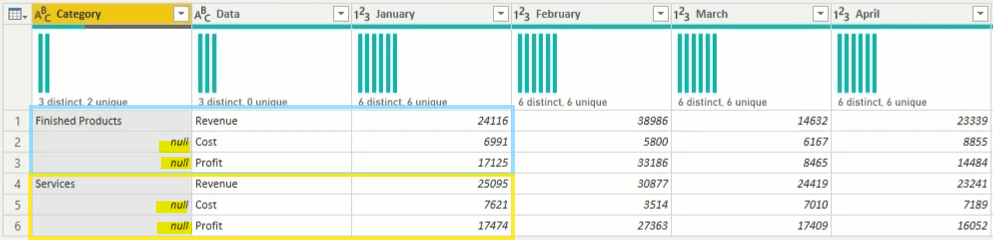
When you see the missing value you need to consider that
“Are those data related to any rows or columns ?”
In the case missing value (or null) related to other rows.
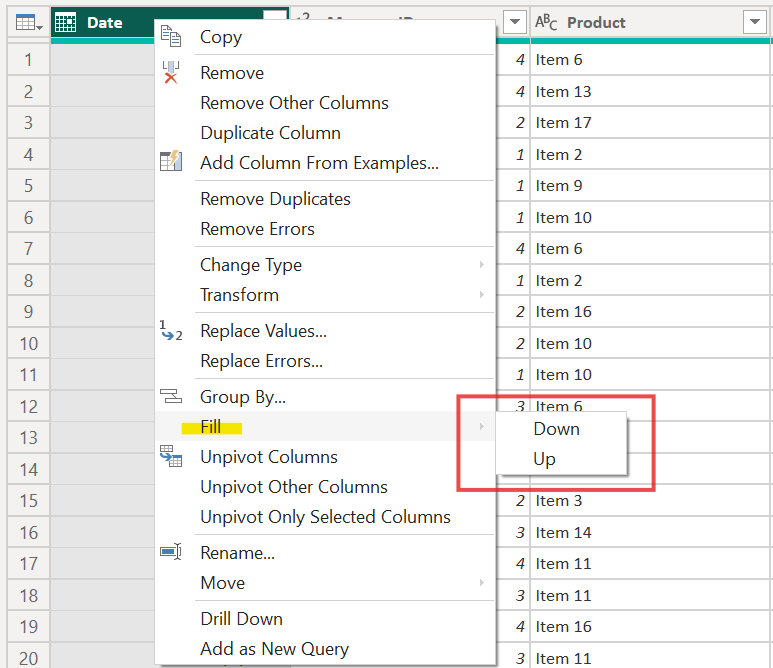
Hence, we need to fill in the blank by using “Fill feature”
Right click > Fill > selecting Down or up.
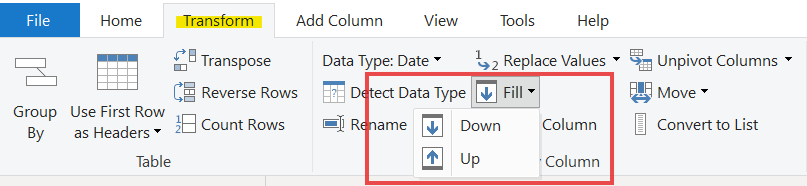
Alternative ways to find “Fill feature”
Here is the result after filling in, blanks are replaced by categories name.
”Please don’t look over with missing value.”
🧶Time to reshape data
Unpivot and Pivot column 🍟
🌟 Unpivot column feature
There are three type of the feature, it’s depended on the functional that you need to apply.
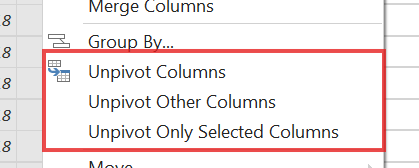
It will be transform long format to wide format or vice vasa.
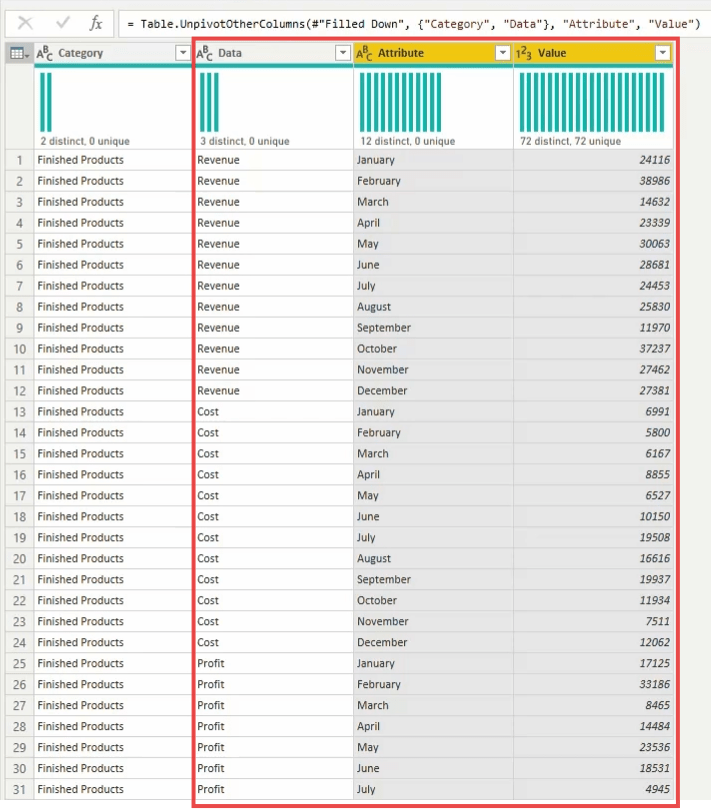
Here is the result after unpivot column the data itself will not change but only structure.
(To be noted that column name can change in the formula box in yellow highlight)
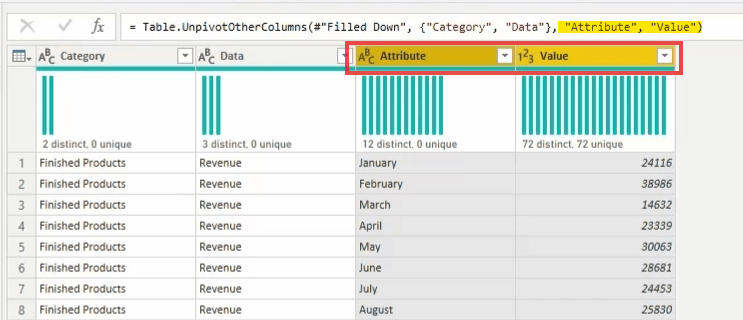
However, there are some conflict of the data that you will see in “Column calls Data”.
🌟Pivot column feature
Another reshare data feature, to separate the subsequent data into column with aggregated function, it’s similar to pivot table in excel.
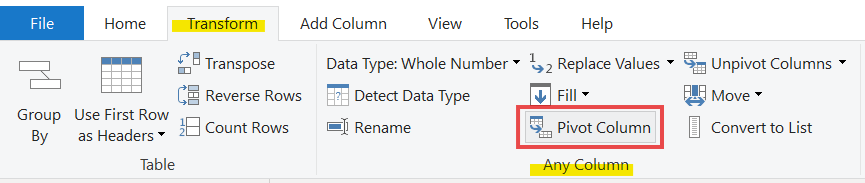
This is where to find the pivot column feature.
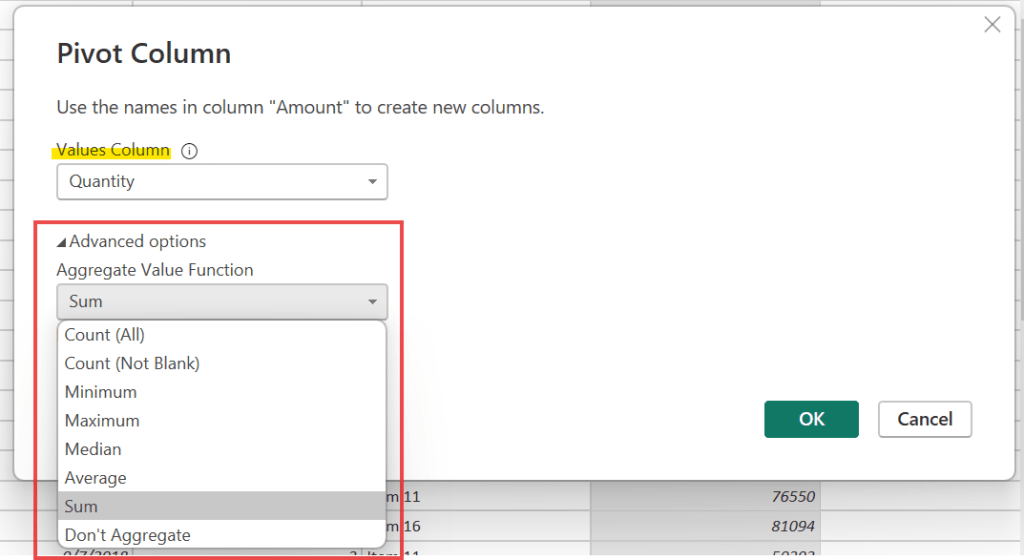
Selecting to column and applying aggregated feature.
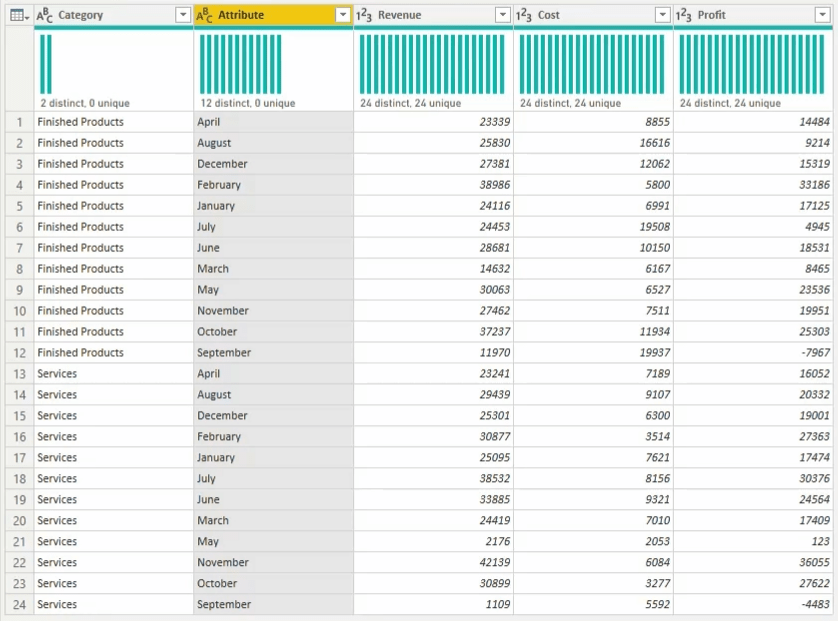
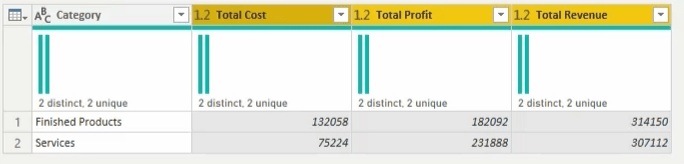
Here is the result, revenue, cost and profit are separated by categories and month.
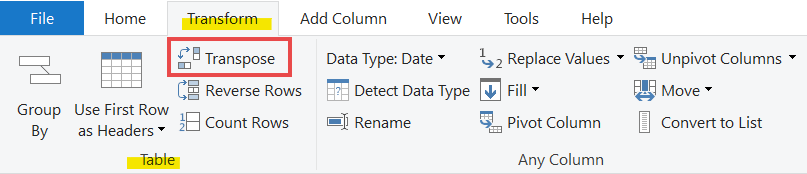
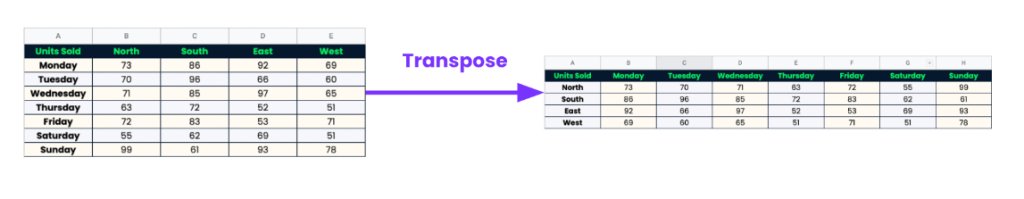
Transpose 🍟
The easily feature for changing rows into columns and columns into rows.
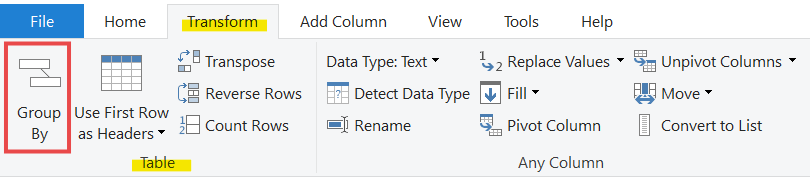
Group by 🍟
To correct rows into the category column and make for data look interesting.
Here is where to find “Group by feature” (or right click)
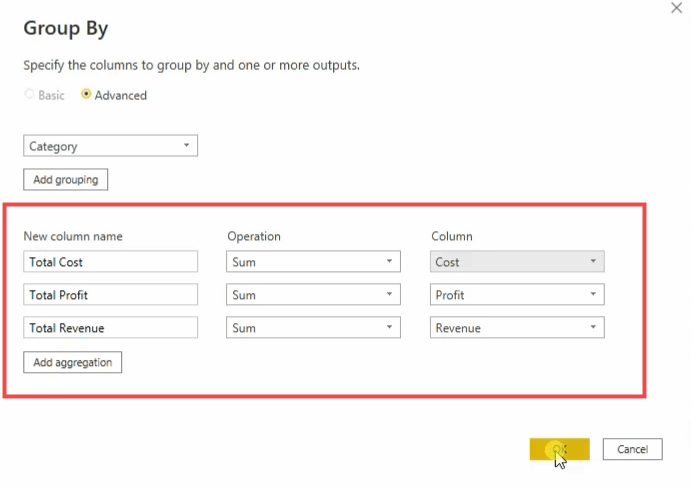
then choosing column that you would like to group after that applying the advanced feature to multiple aggregate data.
(To be note choosing column steps will be depended on point or topic that we need to analyst)
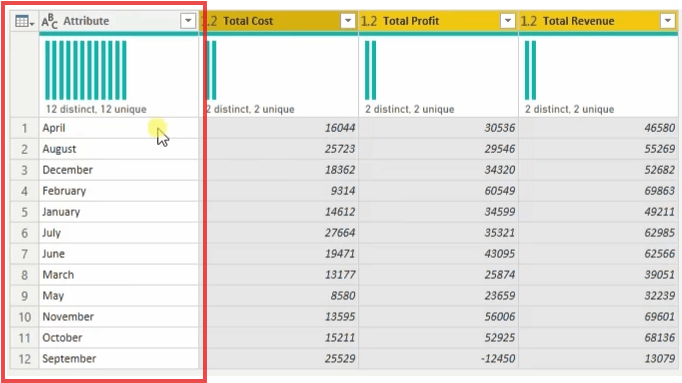
Here is the result, this table is more readable for whole year overview.
It’s alternative way to present cost, profit and revenue by month.
However, month column dose not sort properly so, you can see how to manage it in “Additional Tip and Trick” 😉
Additional Tip & Trick😉
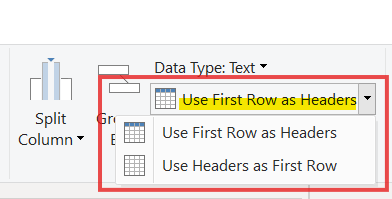
💡To represent column name by first row.
Home > transform session > drop down “Use First Row as Headers”
There is two ways of using the feature, it’s depended on what’s functional that you need.
💡To sort month properly.
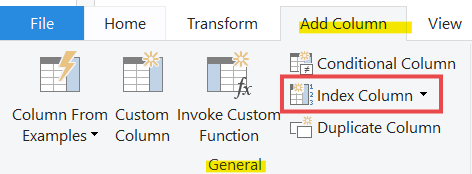
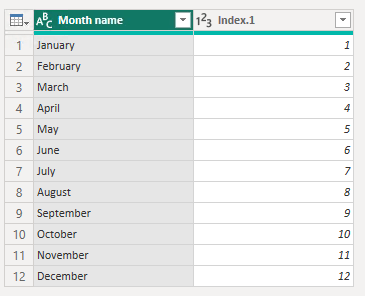
Look for enter data in the ribbon Home tap,
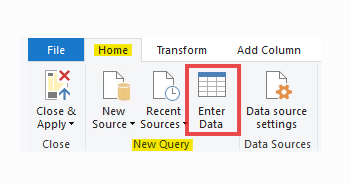
then create new table which contains column month name after that look for Add column tap > add Index column from 1.
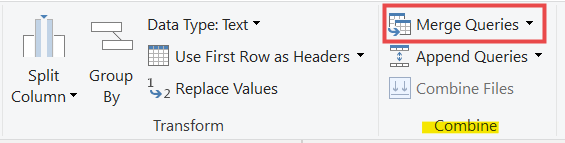
Merger queries between month table and main table
Home tap > Merge queries
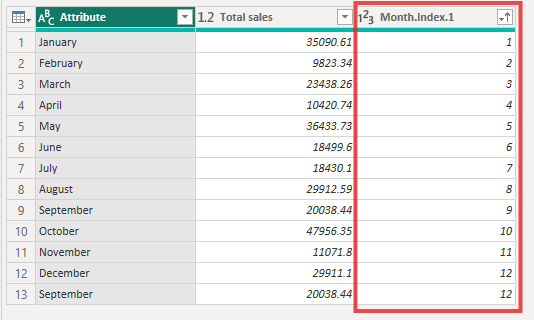
Sort month index column by ascending.
Reshaping data in Power Query is a crucial step in preparing data for analysis because raw data is often not in the optimal format for reporting tools like Power BI or Excel. Proper reshaping (also known as data shaping or transformation) ensures the data is structured correctly for effective analysis, visualization, and summarization.

Leave a comment