
🪐Power Query (Prepare and Repeat)
Power Query is a data transformation and preparation tool.
its user-friendly interface and robust capabilities for shaping and cleansing data from various sources.
Power Query acts as ETL.
ETL = Extract Transform and Load
Transform, which includes a series of transformations to make data suitable for analysis, ensures that the data is consistent, accurate, and in a standardized format.
Loading involves storing the data in a structured manner, making it readily available for reporting, analysis, and business intelligence.
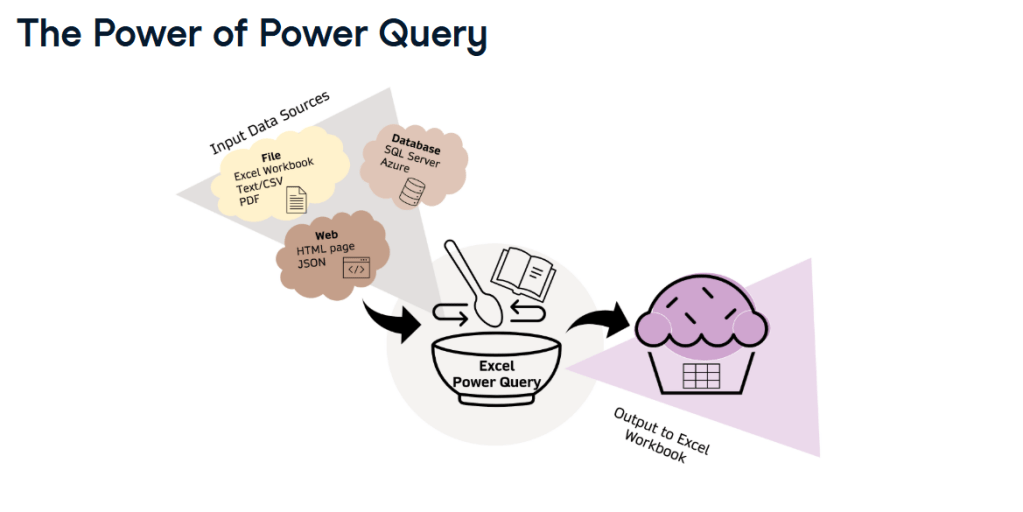
We use power query to interface data in Power BI or excel, this is the data manipulation framework to connect or load the data as well as transform it accordingly.
- To Load and transform data
- Transformation steps are added sequentially which you can see the is applied steps. Kind of recipe that executes every time your data is loaded/refreshed.
Data types in power query
- Numerical (whole number/Decimal/Percentage)
- Date / Time
- Text
- Logical (Ture/False)
- Binary data which is encoded in based64
for more information : https://medium.com/@rongalinaidu/what-is-base64-encoding-and-why-data-engineers-need-to-know-f8b6cebf5bd1
So, we should make sure that the data types have been selected correctly for each column. The power BI or excel will automatically detect the date type that you set it.
🧩 Data preparation concept
Data preparation is core concept of good data analysis to clean dataset.
Importance of Clean Data: Understanding that clean data is vital for ensuring accuracy, efficiency, effectiveness, consistency, and integrity in data analysis.
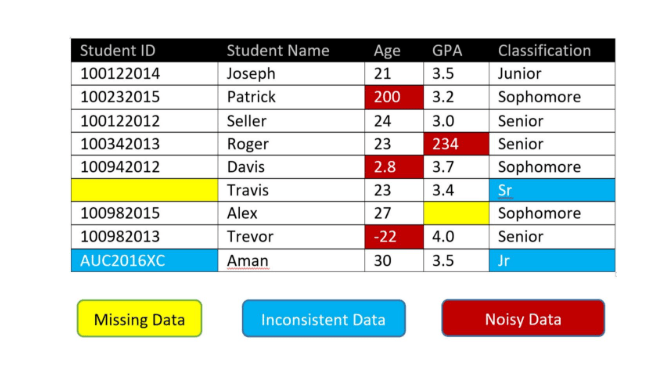
What is clean data ?
- To free from missing value or “null” (Null is blank unequal to zero)
- To clean incorrect typos/data entry that error.
- To clean duplicated data to prevent skewing statistic.
- Irrelevant data is excluded which will remove data that not help us answer our questions.
- Correct the data type for all column that allow is to perform calculation properly.
🧩 Basic data transformation
Basic structural transformation of data (recommend to do it before complex steps)
- Promote header : to make the first row becomes column headers, it’s very useful for excel file.
- Reorder/Remove column : to remove unnecessary column and organize them.
- Remove unnecessary row.
- Rename column to be more descriptive.
Power query demo
Navigate to “Transform data” in the ribbon of power bi desktop to access to Power query.

Import data we go to “New Source” then it will be pop-up the various data connector, choosing where the dataset store in.

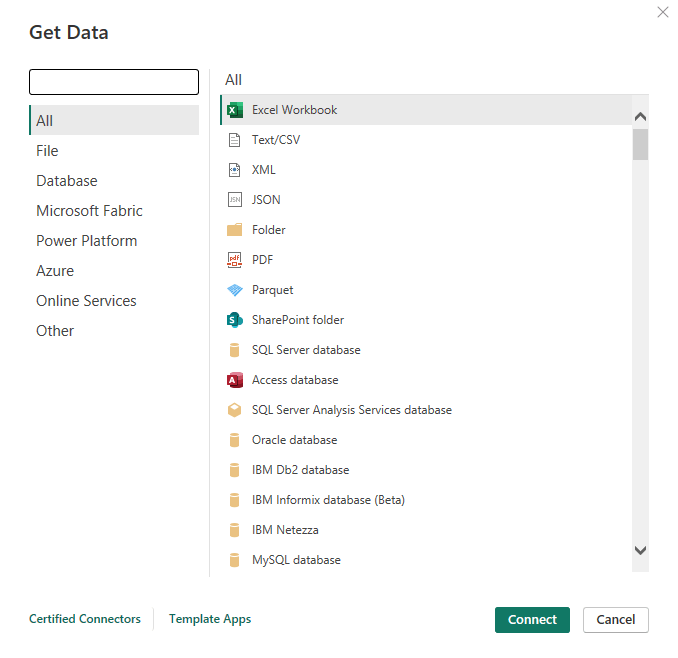
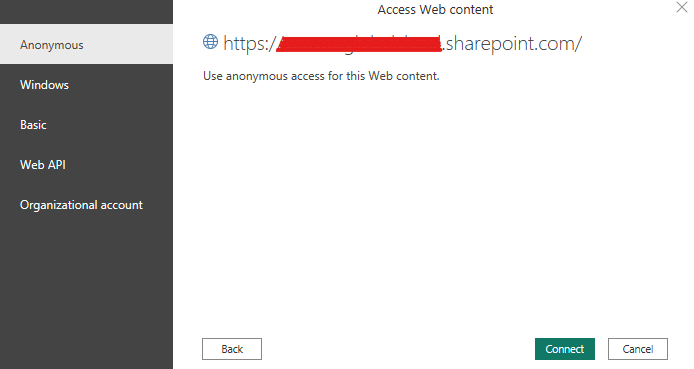
In this case we will connect with Web connector to work on the file which stored in cloud.
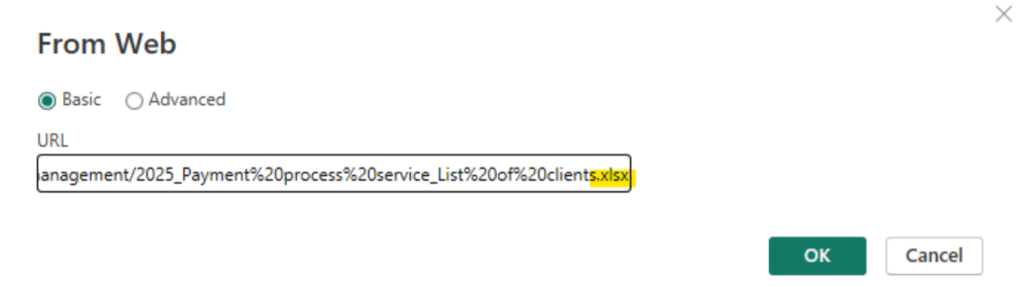
If the content is not freely available for anyone so, we need to enter the special authentication detail, if it not just proceed with “Anonymous” connection.
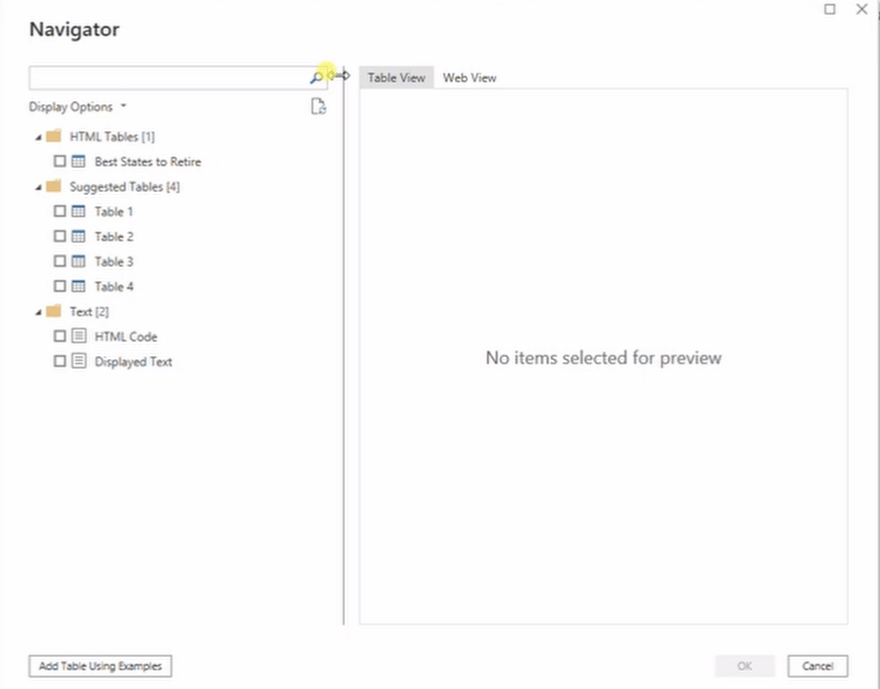
Once, power query connected to the data source successfully, then we can choose the table that we want to import.
The data has imported to Power Query. There will be some steps have been generated that you can see on the right called “APPLIED STEPS”.
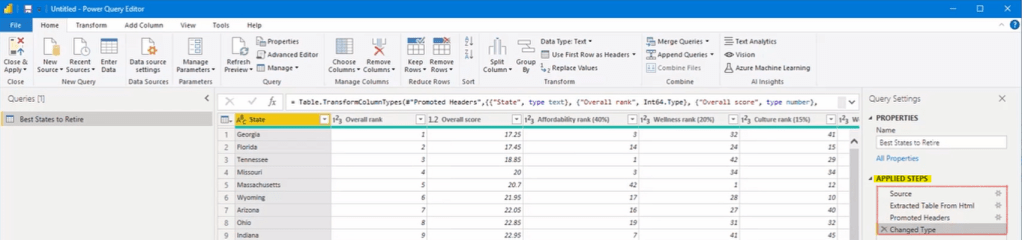
APPLIED STEPS, It’s useful feature for understanding the effect of your transformation which applied on power query.
Using “Promoted Headers” when you see the unappropriated column name instead of rewrite the name by each column.
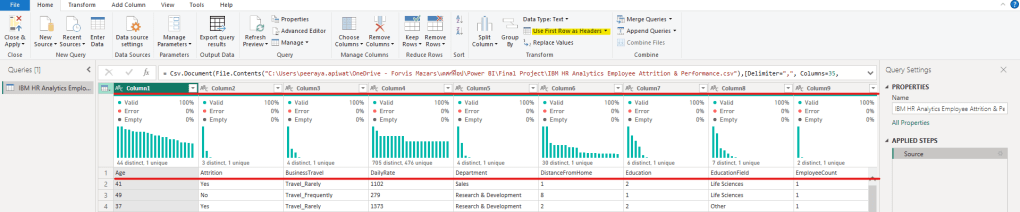
Then review the column quality for valid, error or empty.
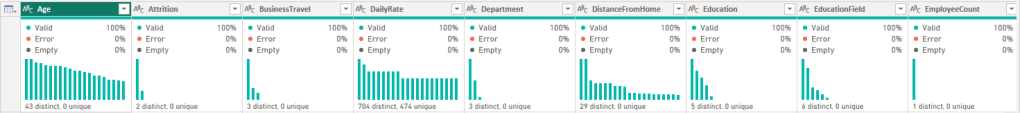
If you cannot see it, navigate to “View” on the ribbon then tick the box of “Column Quality”
- Column Quality: This feature calculates and displays the percentage of valid, error, and empty values under each column name, helping you identify missing or erroneous data.
- Column Distribution: This feature displays a histogram under each column name, showing the count of unique and distinct values. It’s useful for checking for duplicate values.
- Column Profile: This feature provides detailed statistics for a selected column, including average, minimum, maximum, and standard deviation. It also shows the distribution and count of unique and distinct values.
(These features are powerful tools to help you make informed decisions about data transformations and ensure your dataset is ready for analysis.)
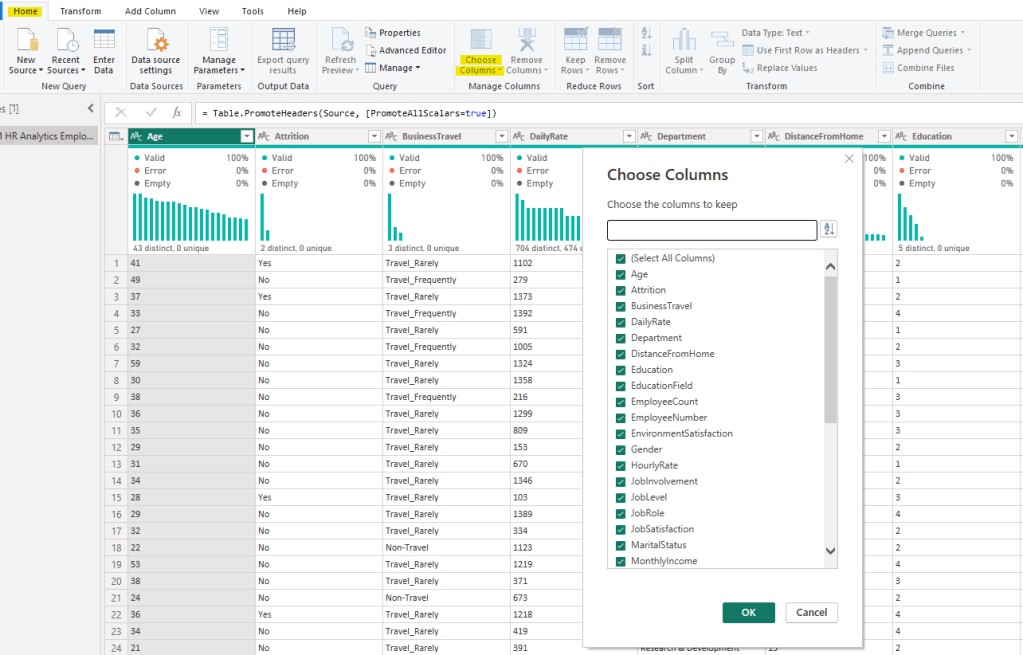
After reviewing “Column Quality” so you can remove the column that unnecessary by navigate to the “Home” looking for “Choose column” then you can un-tick the column that you don’t need.
Remove rows button is beside to manage column section, you can navigate to “Reduce Row” and work on it.
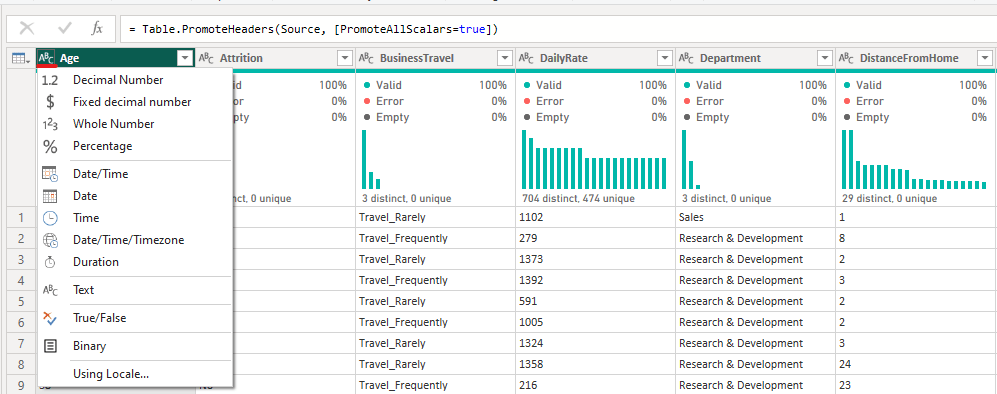
Changing data type is also the important step of basic transformation.
Click on the small icon then selecting the proper data types.
Once the basic steps has done, it’s time to adventure work on the dataset by complex steps such as calculated data, grouping data, unpivot column etc.
🧩 Data manipulation
📔 Transform text
To make sure that your text columns don’t have any obvious typos or incorrect values in them. Those text should be same kind of capitalization, including remove all blank space that appears. In each column should only represent one piece of information, so you might need to split or combine columns in your dataset.
**Checking row and column the lower left corner to make sure your data based on entire dataset.**

There are so many features that you can use in power query to efficiently cleaning your dataset.
Go to tap “Transform” > “Text column”
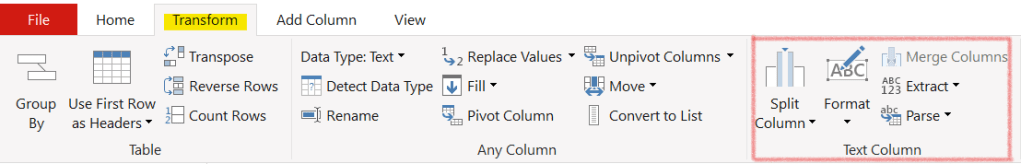
- Format feature to work with capitalization , trim , clean and add prefix/suffix
- Split column to work with a column that contains too many information (a lot information it’s hard to analyst). It can be split by denominator, position, digit or non-digit
**By Digit to Non-Digit: Splits the column at every point a number is followed by a letter or symbol.
**By Non-Digit to Digit: Splits the column at every point a letter or symbol is followed by a number. - Merge column is useful when columns need to combine.
- Extract is pull-out character or any data you want from the column.
- Parse to break data down into smaller, structured components, handling structured data like JSON/XML, splitting delimited text, and extracting patterns.
📔 Numerical Transformation
Unclean numbers could lead to distraction, especially DATE because the standard numeric transformations cannot be applied on them.
Got to ribbon > Transformation > Number column to apply number column.
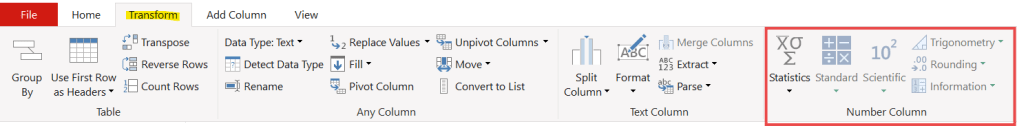
Statistic icon is performed statistic operations such as sum, min, max, SD and count.
Standard icon is performed standard math operation such as multiply, percentage and divide.
Scientific icon is performed scientific operations such as Square root and absolute value.
Got to ribbon > Transformation > Date & Time column to apply column that present date type.

Date, time and duration are used to format or extract element.
After data cleansing and shaping, you can update the source then power query will be repeated automatically data by recording transformation steps.
This is especially useful for recurring reports or analyses that use data from the same source format every time.

Leave a comment